Understanding the Dashboard
The MatchGrid dashboard is your command center for managing schedules. It provides at-a-glance metrics, quick actions, and workflow guidance to help you stay on track.
Accessing the Dashboard
Click Dashboard in the sidebar (or go to /dashboard). This is your home screen after logging in.
Dashboard Layout
The dashboard is organized into several key areas:
Header Bar
At the top, you’ll find:
- Region Selector: Switch between regions/conferences you manage
- Season Selector: Toggle between active and upcoming seasons
- Search: Find teams, locations, or events quickly
- Profile Menu: Access settings, help, and sign out
Metrics Grid
The metrics grid shows your current scheduling status:
| Metric | What It Shows |
|---|---|
| Teams | Total teams in the selected season |
| Locations | Venues configured with availability |
| Events | Scheduled games/matches count |
| Conflicts | Scheduling issues requiring attention |
[!INFO] Click any metric card to jump directly to that section. For example, clicking “Conflicts” opens the conflict resolution view.
Setup Workflow (New Users)
If you’re just getting started, the dashboard shows a Setup Workflow with guided steps:
- Configure Terminology — Set your sport-specific labels
- Create Season — Define your season dates
- Add Teams — Import or create your teams
- Add Locations — Set up venues and courts
- Set Blackouts — Mark unavailable dates
Each step shows a checkmark when complete. Once all setup steps are done, you’ll transition to the scheduling workflow.
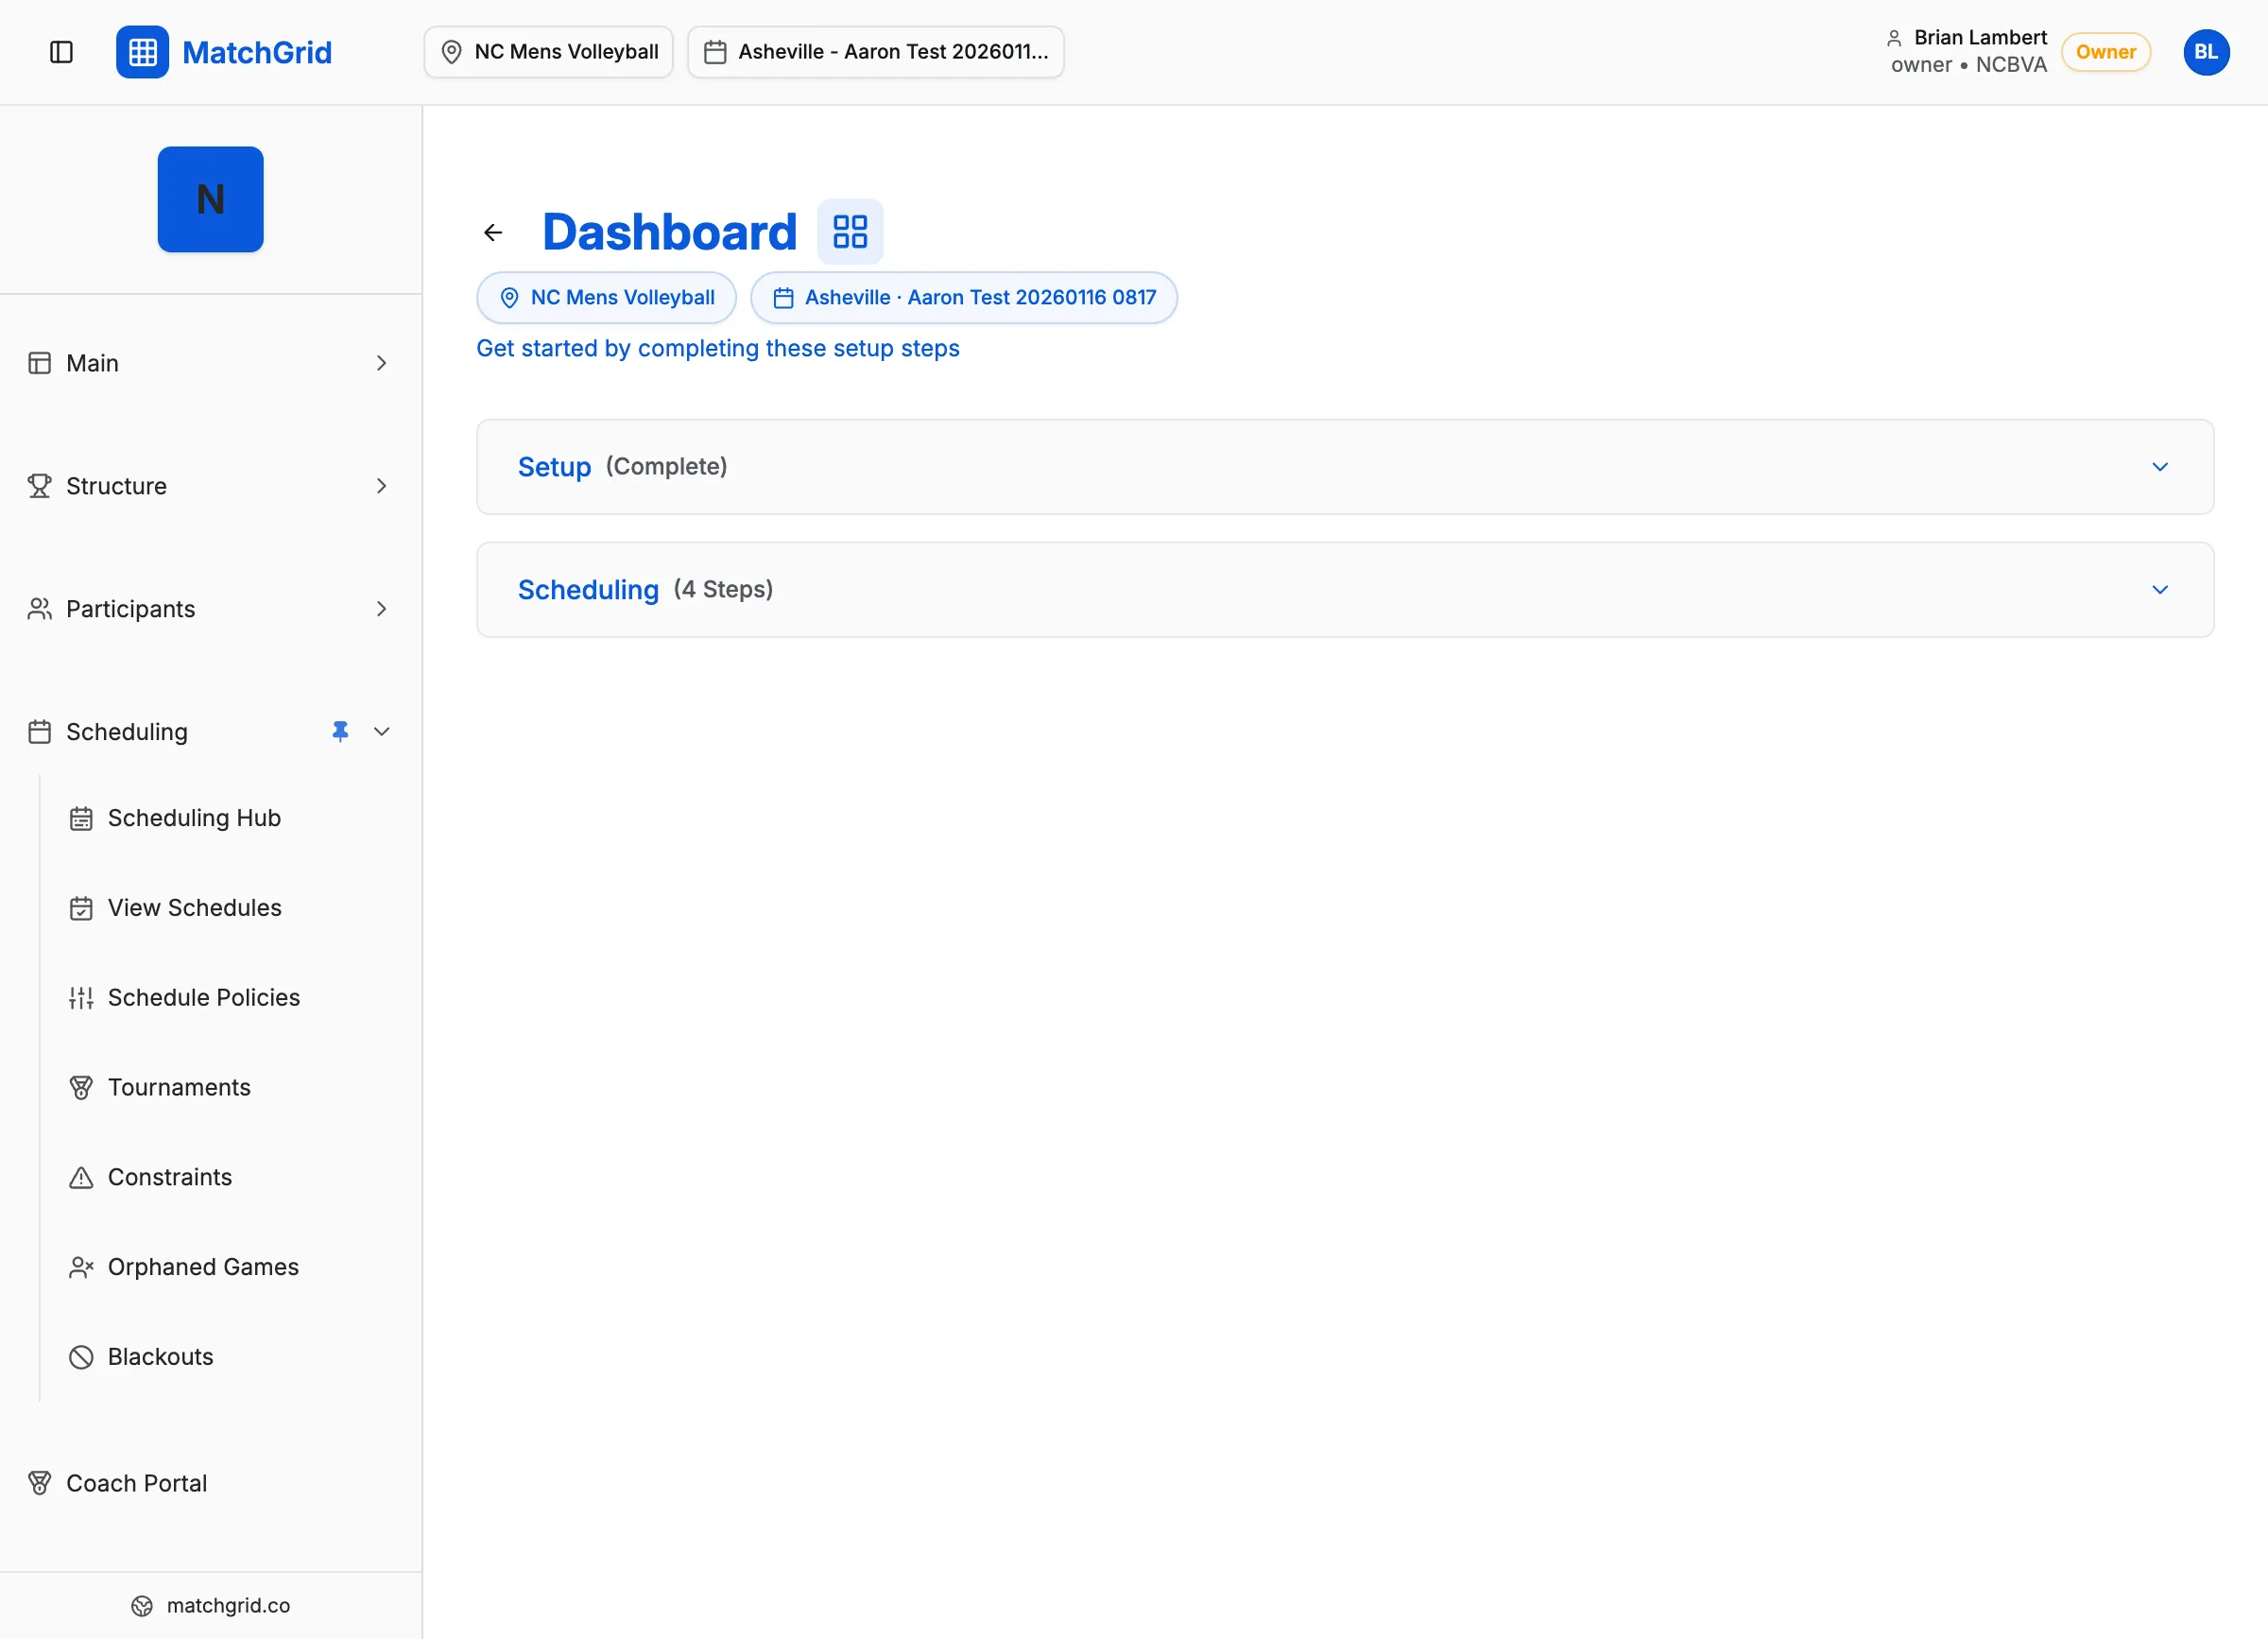
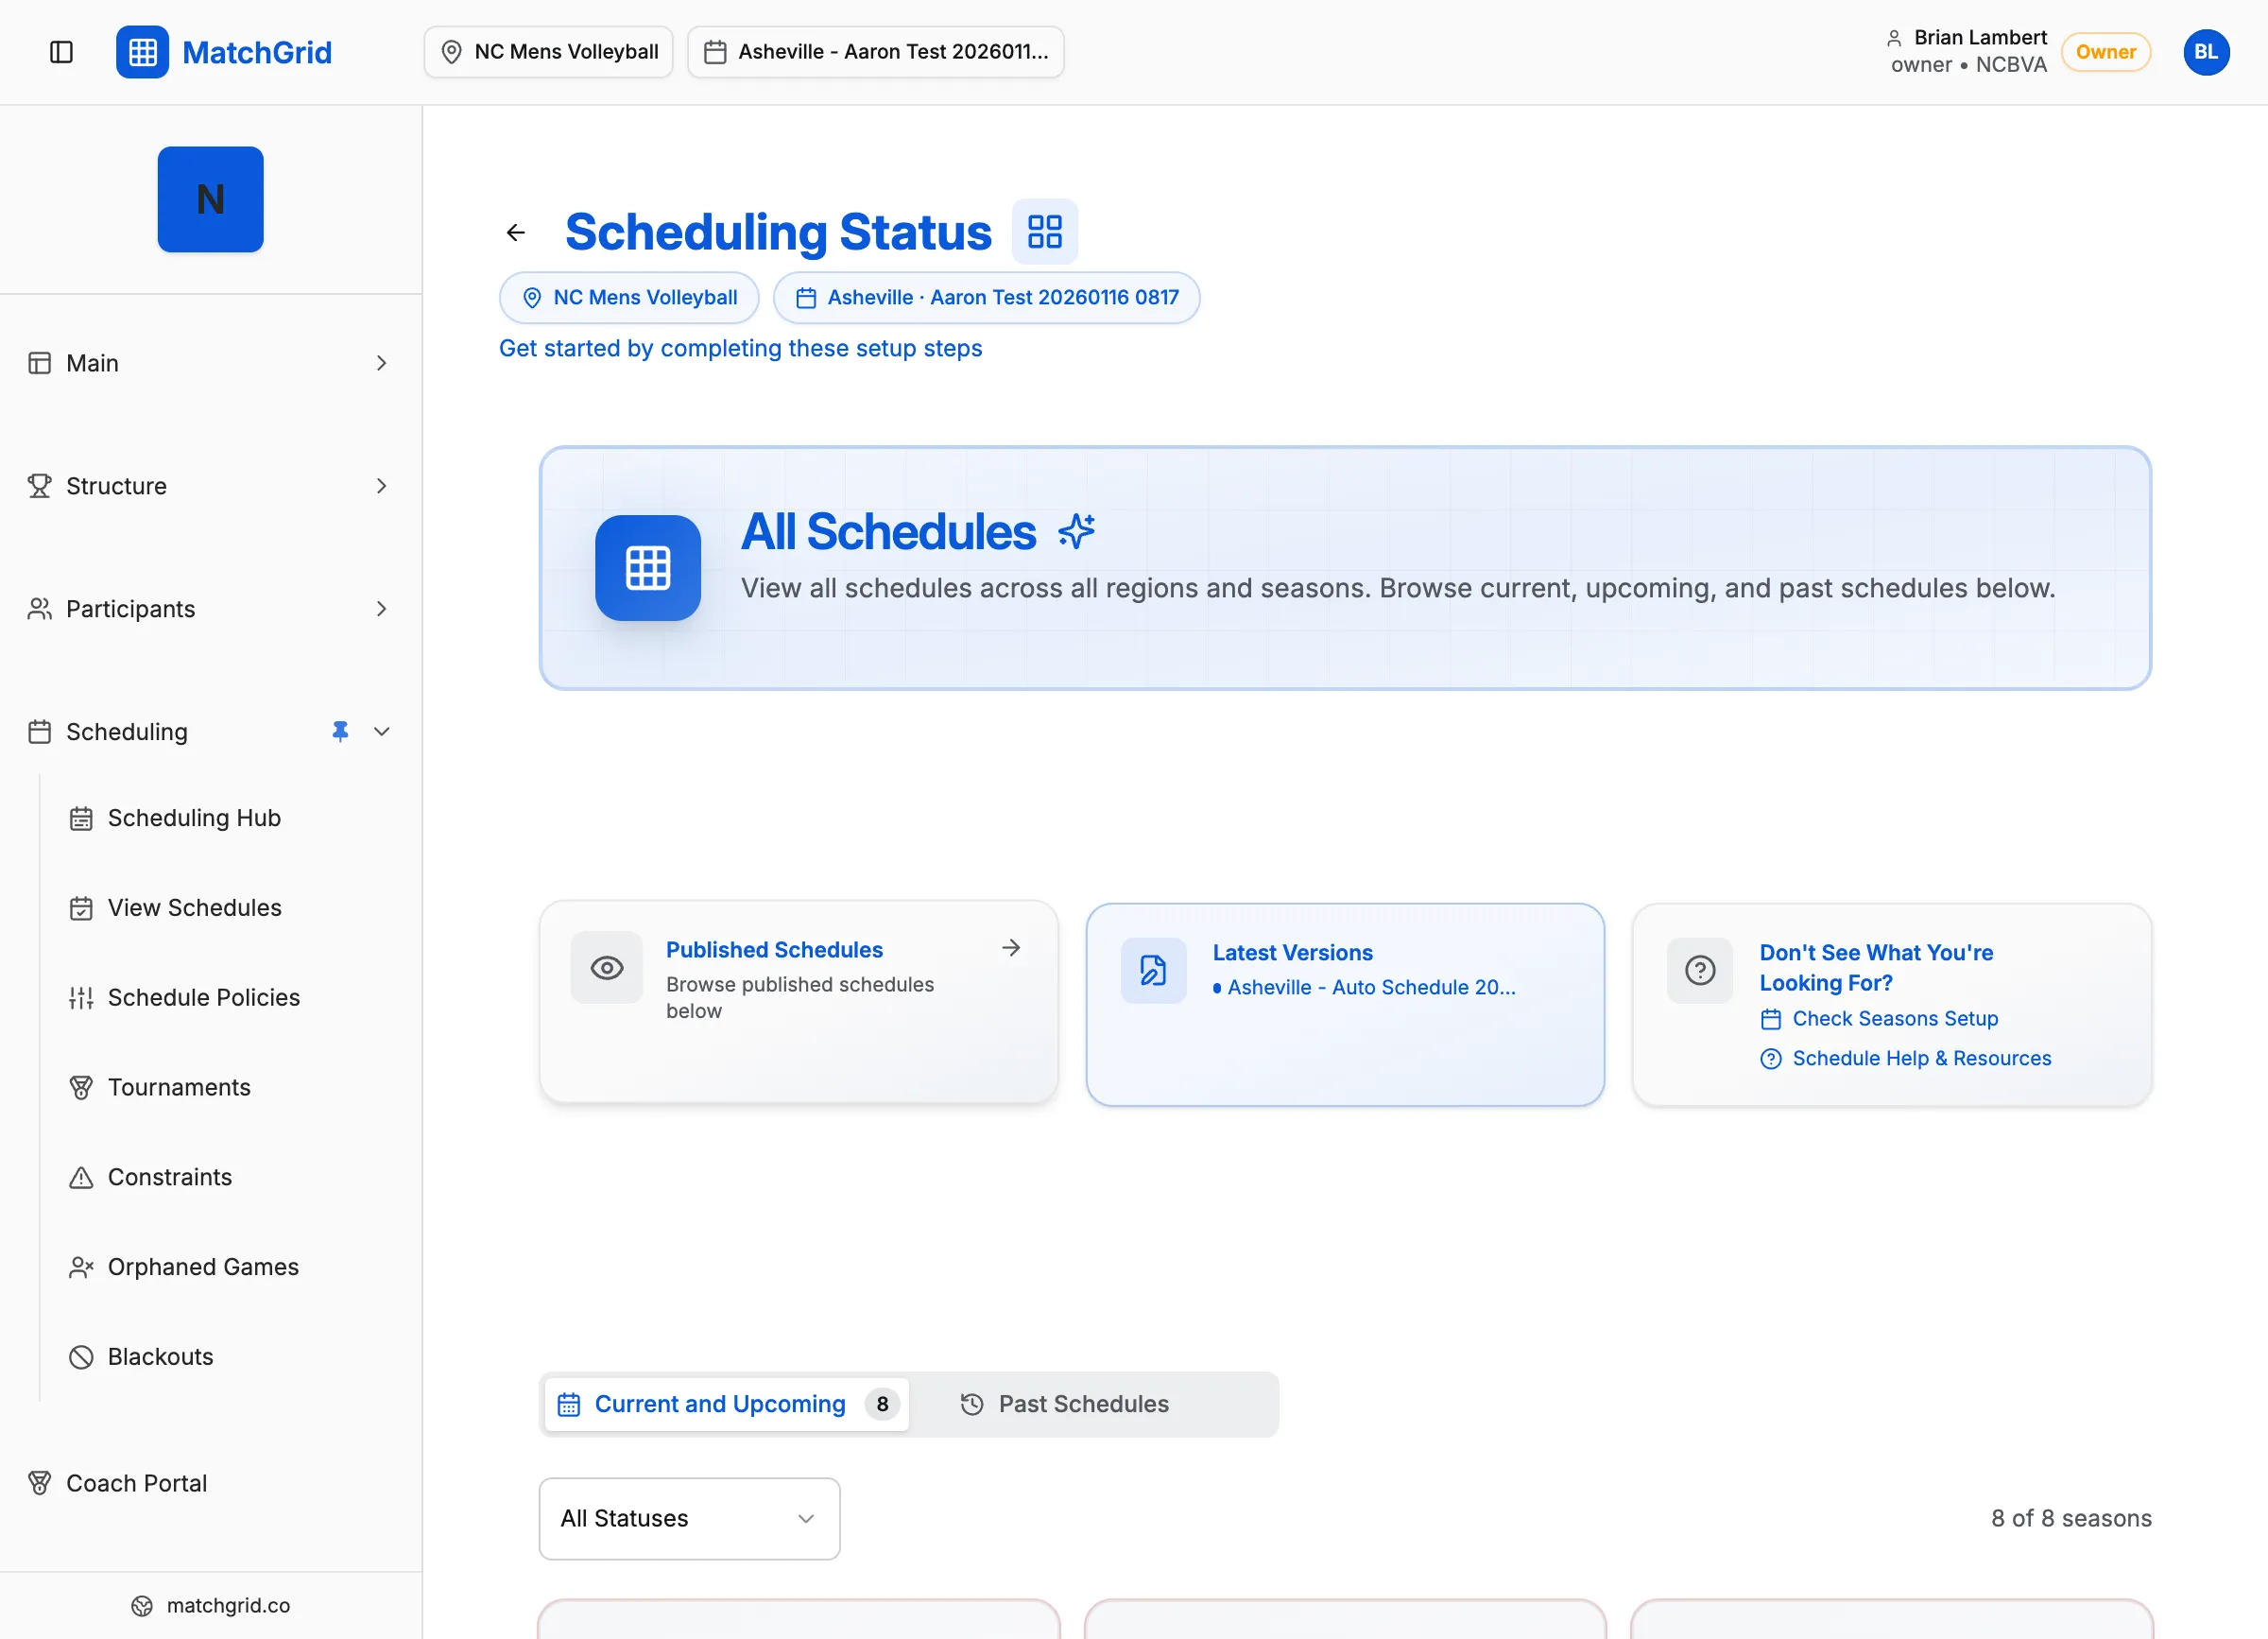
Scheduling Workflow
After setup, the dashboard displays two scheduling tracks:
Manual Track
For hands-on schedule creation:
- Create Events — Add games one by one
- Review Calendar — Visual calendar view
- Publish — Make schedule visible to teams
Auto-Scheduler Track
For AI-powered scheduling:
- Configure Constraints — Set rules and preferences
- Generate Schedule — Run the AI scheduler
- Review & Adjust — Fine-tune the results
- Publish — Share with your league
[!TIP] You can switch between tracks at any time. Many users generate a baseline with the auto-scheduler, then make manual adjustments before publishing.
Quick Actions
The sidebar provides fast access to common tasks:
- Teams: Add, edit, or archive teams
- Locations: Manage venues and court availability
- Blackouts: Set organization-wide blocked dates
- Schedule: View calendar and manage events
- Constraints: Review and resolve scheduling issues
Data Tables
Below the metrics, you’ll find summary tables showing:
- Upcoming Events: Next games on the schedule
- Recent Activity: Latest changes and updates
- Teams Needing Attention: Teams missing required data
Filtering by Context
Use the Region and Season dropdowns to filter everything you see. The dashboard, metrics, and all child pages automatically scope to your selection.
Pro Tips
- Keyboard Shortcuts: Press
?to see available shortcuts - Breadcrumbs: Use the breadcrumb trail to navigate up the hierarchy
- Contextual Help: The
?icon in corners shows relevant help articles
Your dashboard remembers your last-used region and season, so you’ll return to the same context each visit.