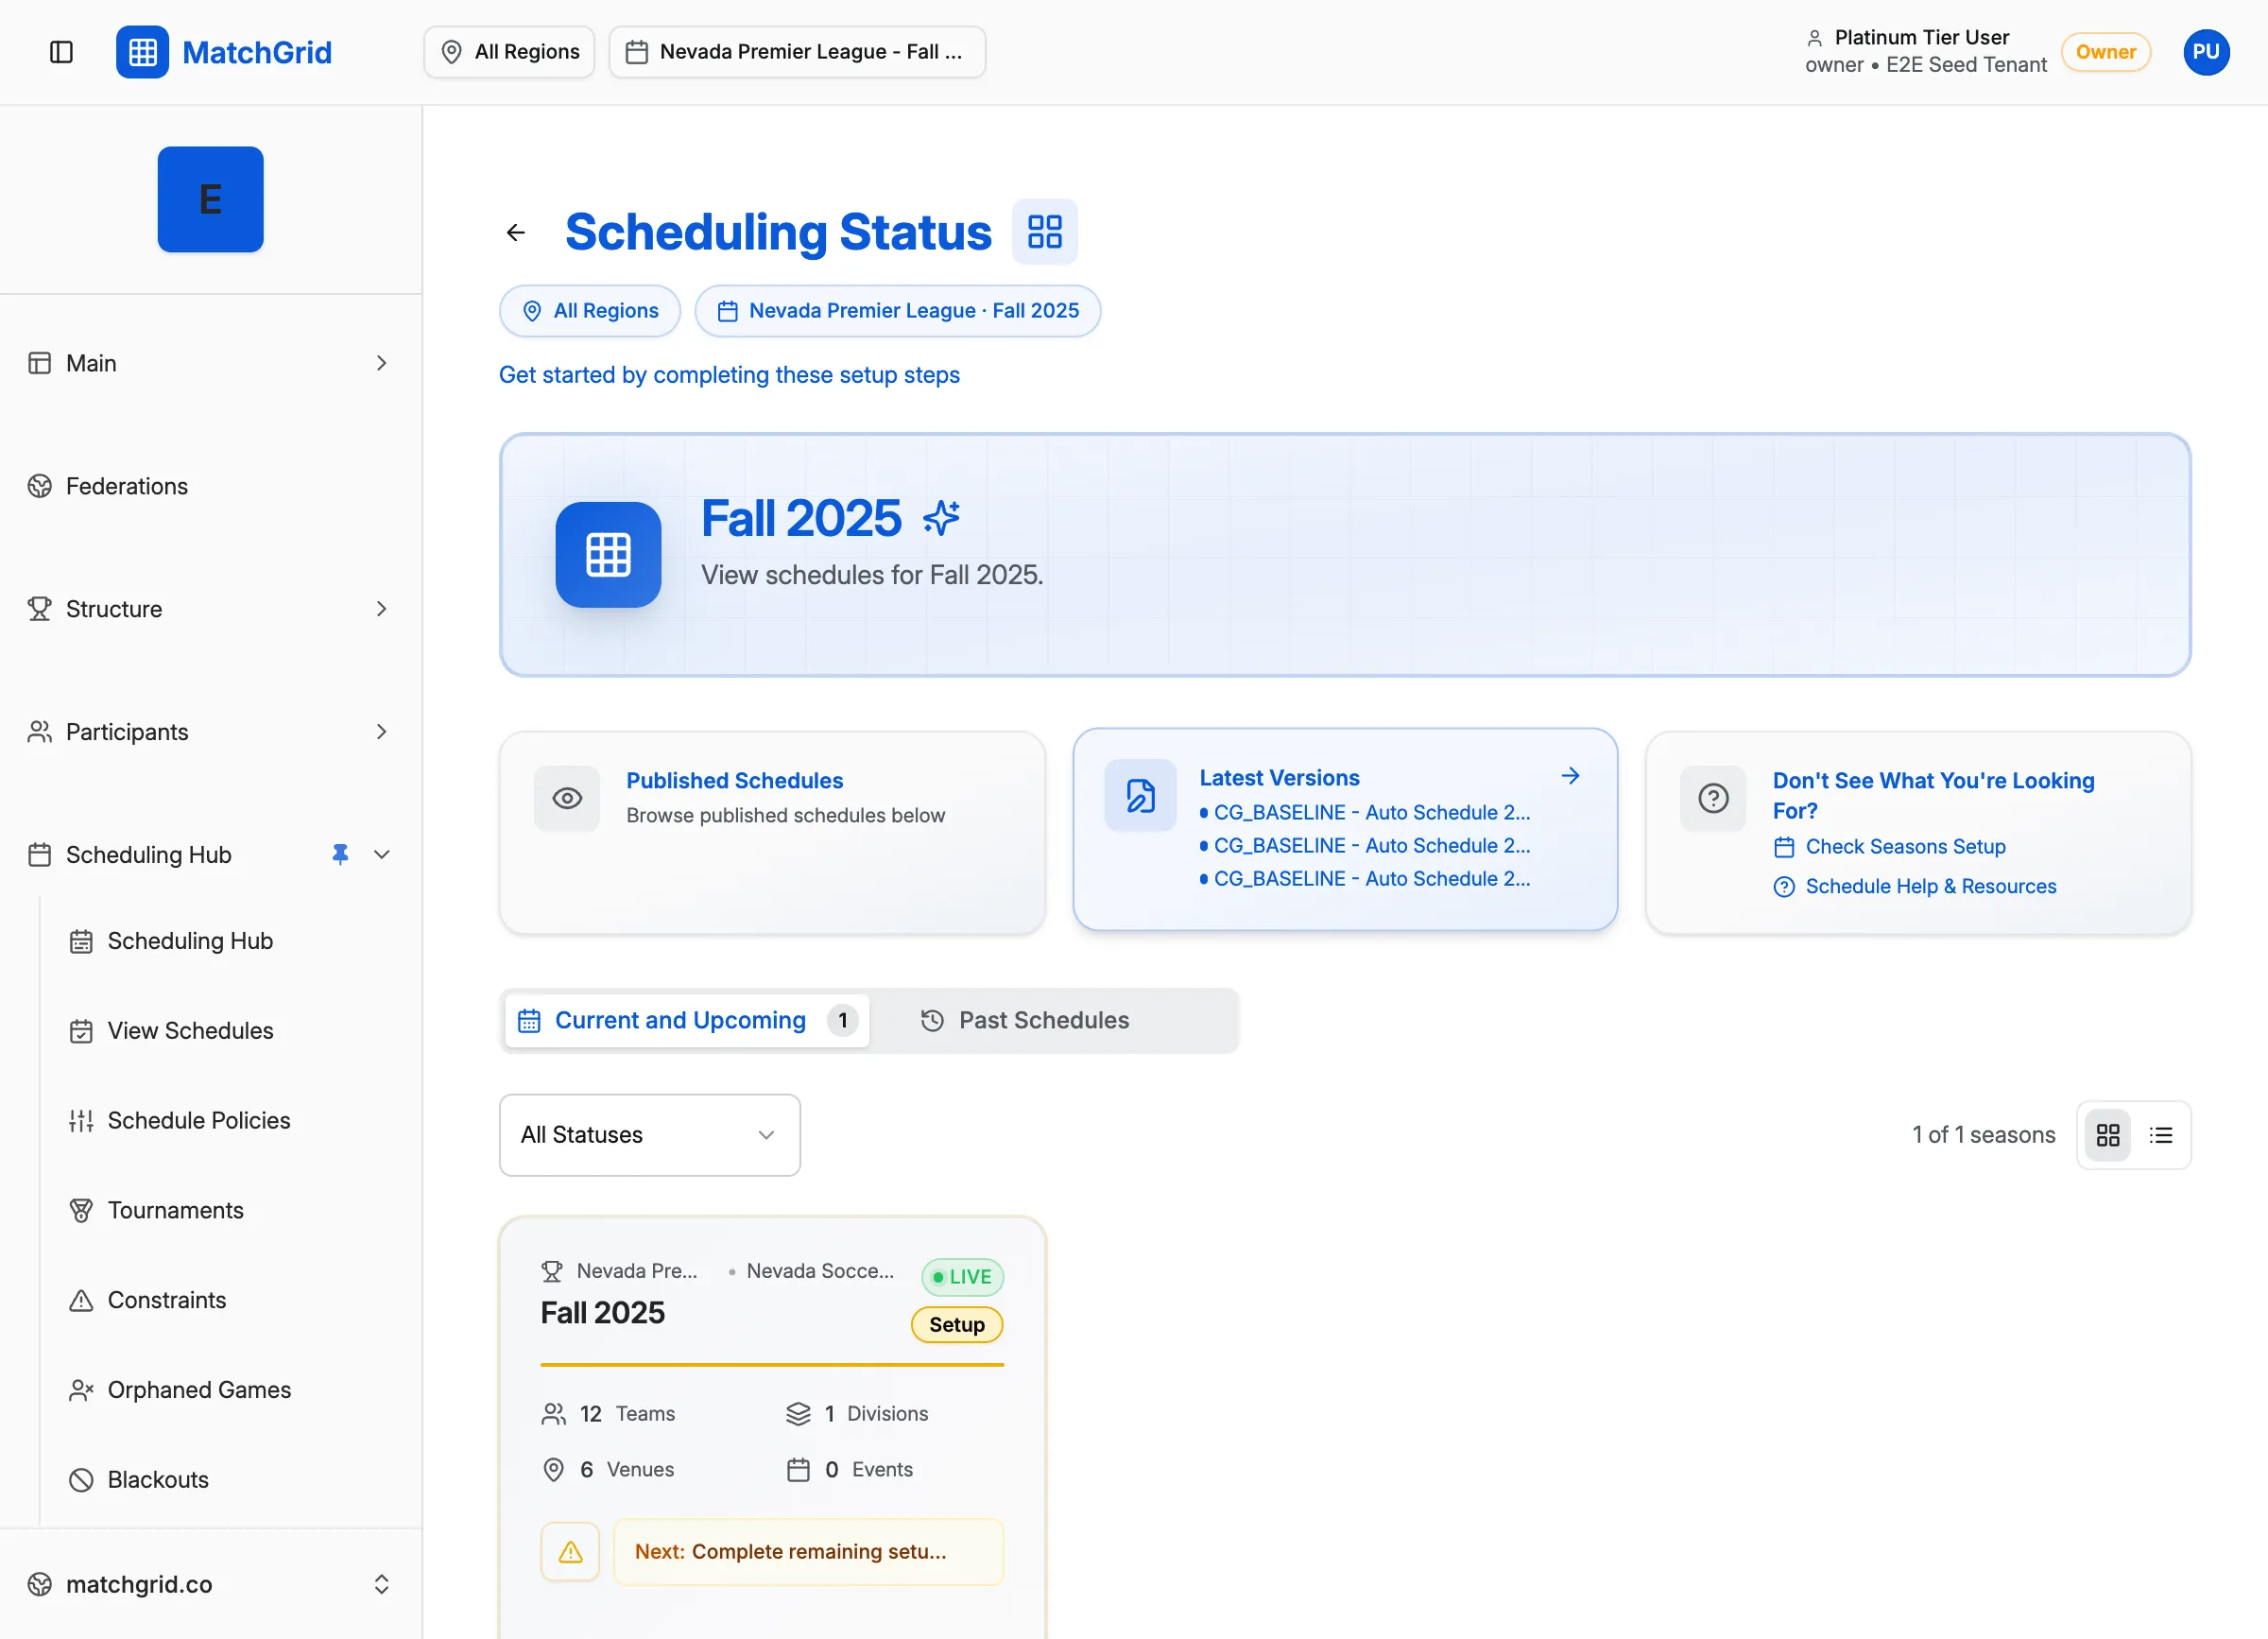
Understanding Schedule Metrics
MatchGrid tracks several metrics to help you evaluate schedule quality, fairness, and team satisfaction. These metrics appear after generating a schedule and throughout the season.
Core Metrics
Feasibility Score
A percentage indicating how well constraints were satisfied:
| Score | Rating | Meaning |
|---|---|---|
| 95-100% | Excellent | All major constraints met |
| 85-94% | Good | Minor soft violations only |
| 70-84% | Acceptable | Some compromises made |
| Below 70% | Needs Review | Significant violations |
Home/Away Balance
Measures equity in home vs away games per team:
- Perfect Balance: Equal home and away games
- Acceptable Variance: ±1 game difference
- Imbalanced: Review teams with large differences
Travel Metrics
Total Miles by Team
Shows cumulative travel distance for each team:
- Helps identify teams with disproportionate travel burden
- Compare against configured travel limits
- Useful for planning future schedule adjustments
Longest Trip
The maximum single-trip distance for each team:
- Highlights potentially difficult road trips
- Consider splitting long trips across multiple weekends
[!TIP] If one team has significantly more travel than others, consider adjusting home/away assignments or finding neutral venues for future seasons.
Fairness Reports
MatchGrid calculates fairness across multiple dimensions:
Bye Distribution
For leagues with uneven team counts, byes should be distributed fairly.
Rest Days Between Games
Minimum recovery time should be consistent across all teams.
Prime Time Slots
Weekend and evening games should be distributed equitably.
Using Metrics to Improve
After reviewing metrics:
- Identify outliers — Teams with extreme values
- Understand causes — Limited venues? Restrictive blackouts?
- Adjust inputs — Add locations, relax constraints
- Re-generate — Run auto-scheduler with new settings
- Compare — Check if metrics improved
Exporting Reports
Download metric reports for stakeholder meetings:
- Go to Analytics
- Click Export Report
- Choose format (PDF or Excel)
- Select metrics to include
Reports include visualizations and raw data tables.